
When you start to get interested in trading, one question often comes up:
“What technical indicators should be used to analyze the markets?”
And with the sheer number of tools available, it's easy to get lost.
Good news: You don't need to know 50 of them to begin.
In this article, you will discover the 5 of the most useful indicators for beginners in trading, with simple explanations, concrete examples, and practical advice.
What technical indicators should be used when starting out?
The best technical indicators to start with are:
- THE moving averages to follow the trend
- THE RSI to identify market excesses
- THE MACD to confirm the reversal signals
- THE Bollinger Bands to detect volatility
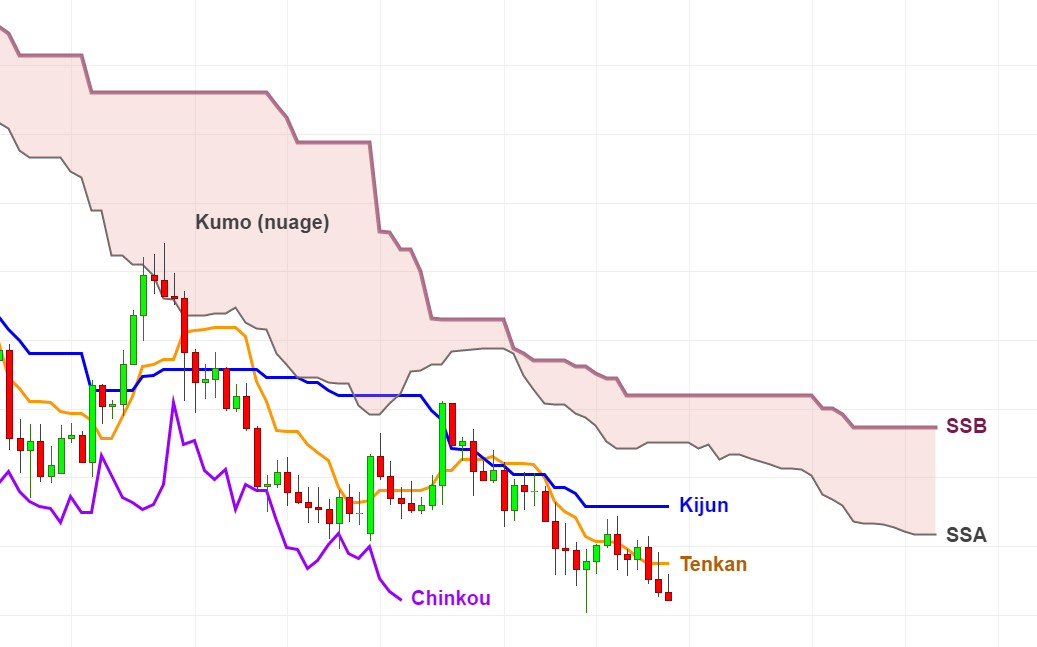
- L'’Ichimoku for more visual and advanced traders
The goal is to understand how they work without overusing them.
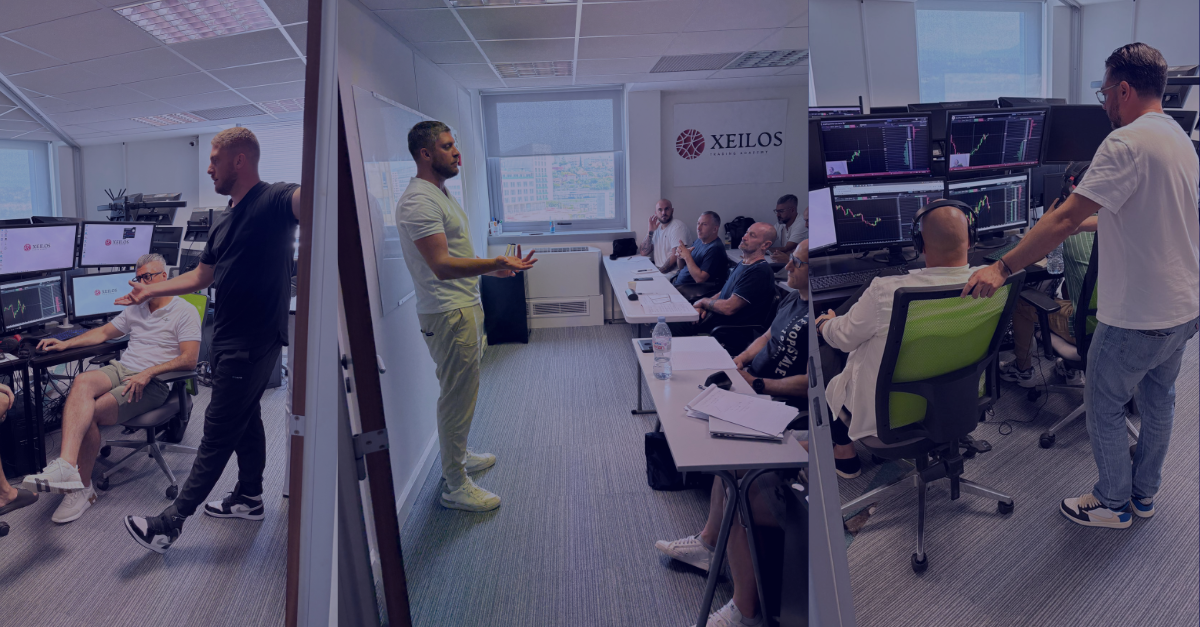
At Xeilos, we teach you how to combine them intelligently in a structured trading plan.
📞 Would you like to discuss this with a Xeilos trainer?
1. Moving averages: easily follow the trend
Moving averages are the the most used indicators in the world.
They allow smooth the price to visualize the underlying trend.
The two main types:
- SMA Simple moving average
- EMA : Exponential moving average (more reactive)
📌 Synthesis
Use a SMA50 to identify the medium-term trend, and a EMA20 for faster signals.
💡 Did you know that?
THE crossing between a short-term average and a long-term average (e.g., EMA20 > SMA50) can give a buy or sell signal.
2. The RSI: measuring market strength and excesses
THE RSI (Relative Strength Index) is an oscillator that indicates whether an asset is in overbought zone (>70) Or oversold (<30).
- Overbought: correction possible in the near future
- Oversold: possible rebound
✅ Trick :
Don't blindly follow the RSI. Wait for a turnaround confirmed (e.g., break of trend line on the RSI).
📊 Key figure :
The RSI is used in Over 65 % trading strategies for beginners according to TradingView.
3. The MACD: Identifying trend reversals
THE MACD combines two moving averages to identify bullish or bearish reversals.
It also displays a “signal line” and a histogram that gives indications of momentum.
- MACD crossover above the signal line = potential buy
- Crossover below = sell signal
📌 Synthesis
The MACD is particularly useful in day trading and swing trading to confirm an emerging trend.
4. Bollinger Bands: Visualizing Volatility
THE Bollinger Bands frame the price with two bounds on either side of a moving average.
They widen when the market is volatile, and contract during calm phases.
👉 What is it for?
- If the price touches the upper band = possible bullish overbought condition
- If the price touches the lower band = possible overbought condition
- If the bands tighten = possible explosion of volatility future
❌ Absolutely avoid
To believe that touching the band automatically means a turnaround. You must always Awaiting confirmation.
🎓 See our certified training courses with no prerequisites
5. The Ichimoku indicator: an overview at a glance
L'’Ichimoku Kinko Hyo is a Japanese indicator that combines trend, support/resistance and timing.
It's a tool visual, ideal for traders who like to see the market structure at a glance.
It includes several elements (cloud, Tenkan, Kijun, Chikou…), but to start, you can focus on:
- THE cloud (Kumo) for the trend
- THE Tenkan/Kijun cross for the signals
💡 Did you know that?
Ichimoku is very popular in the swing trading because it allows us to evaluate the potential for a trend to continue.
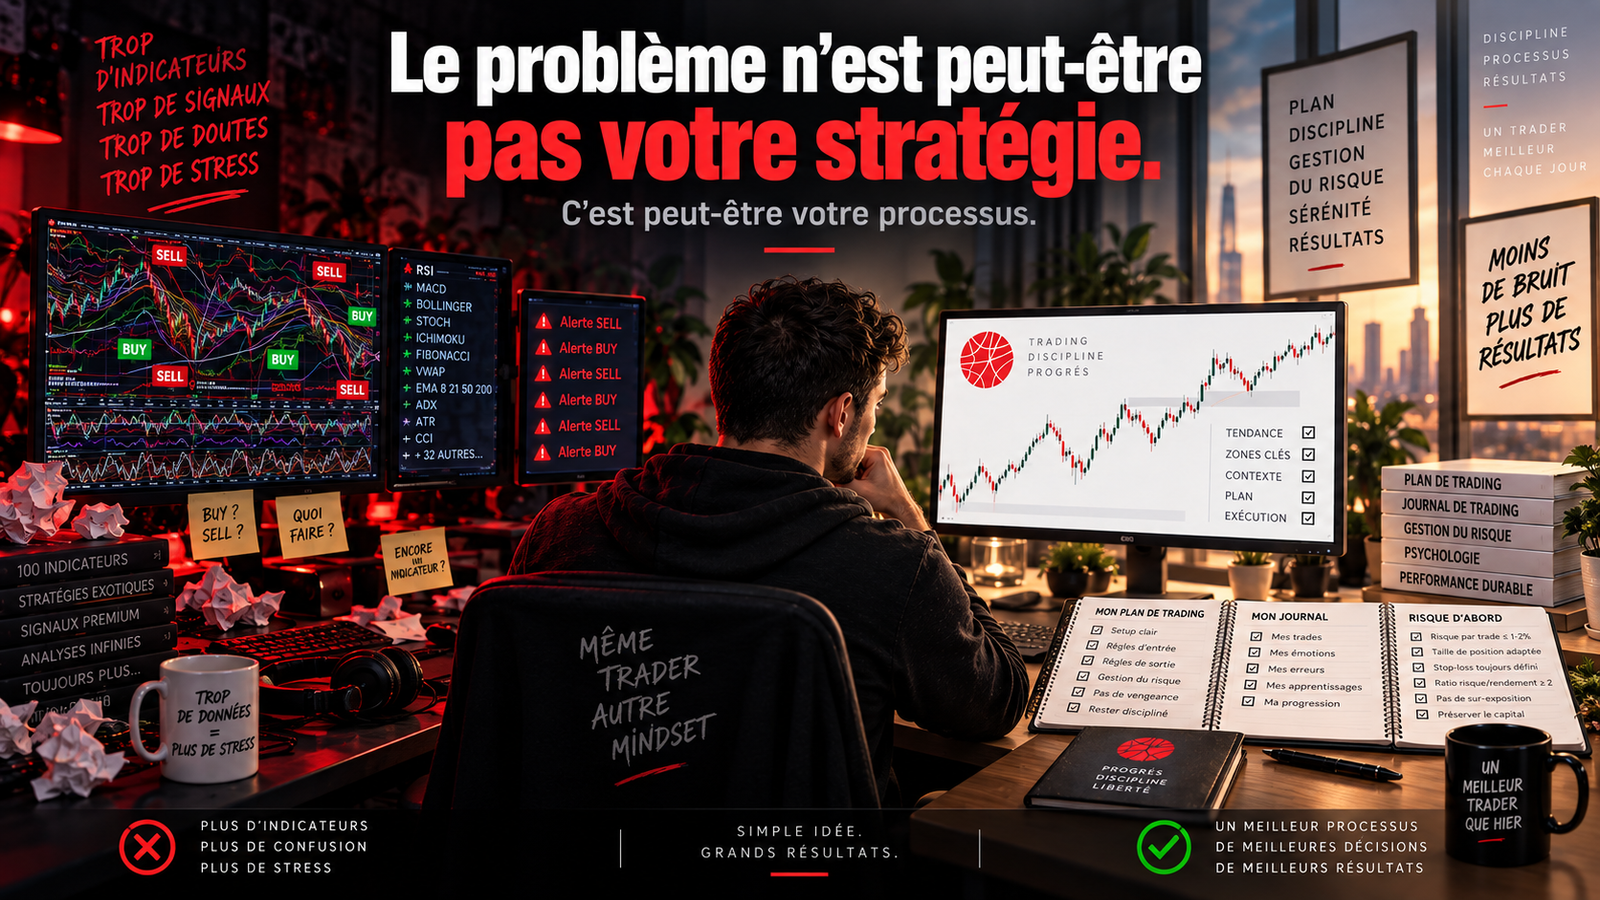
6. How many indicators should you use? Fewer is better.
A common mistake beginners make is putting some on too much. This creates what is called a “jungle indicator” :
→ Unreadable screens, contradictory signals, and more confusion than help.
✅ Trick :
Use 2 to 3 indicators maximum. For example: Moving average + RSI; MACD + Bollinger Bands; Ichimoku alone (it is comprehensive)
📌 Synthesis
The purpose of the indicators is not not to guess the future, but of to help you make rational decisions.
Conclusion: Indicators are tools, not oracles.
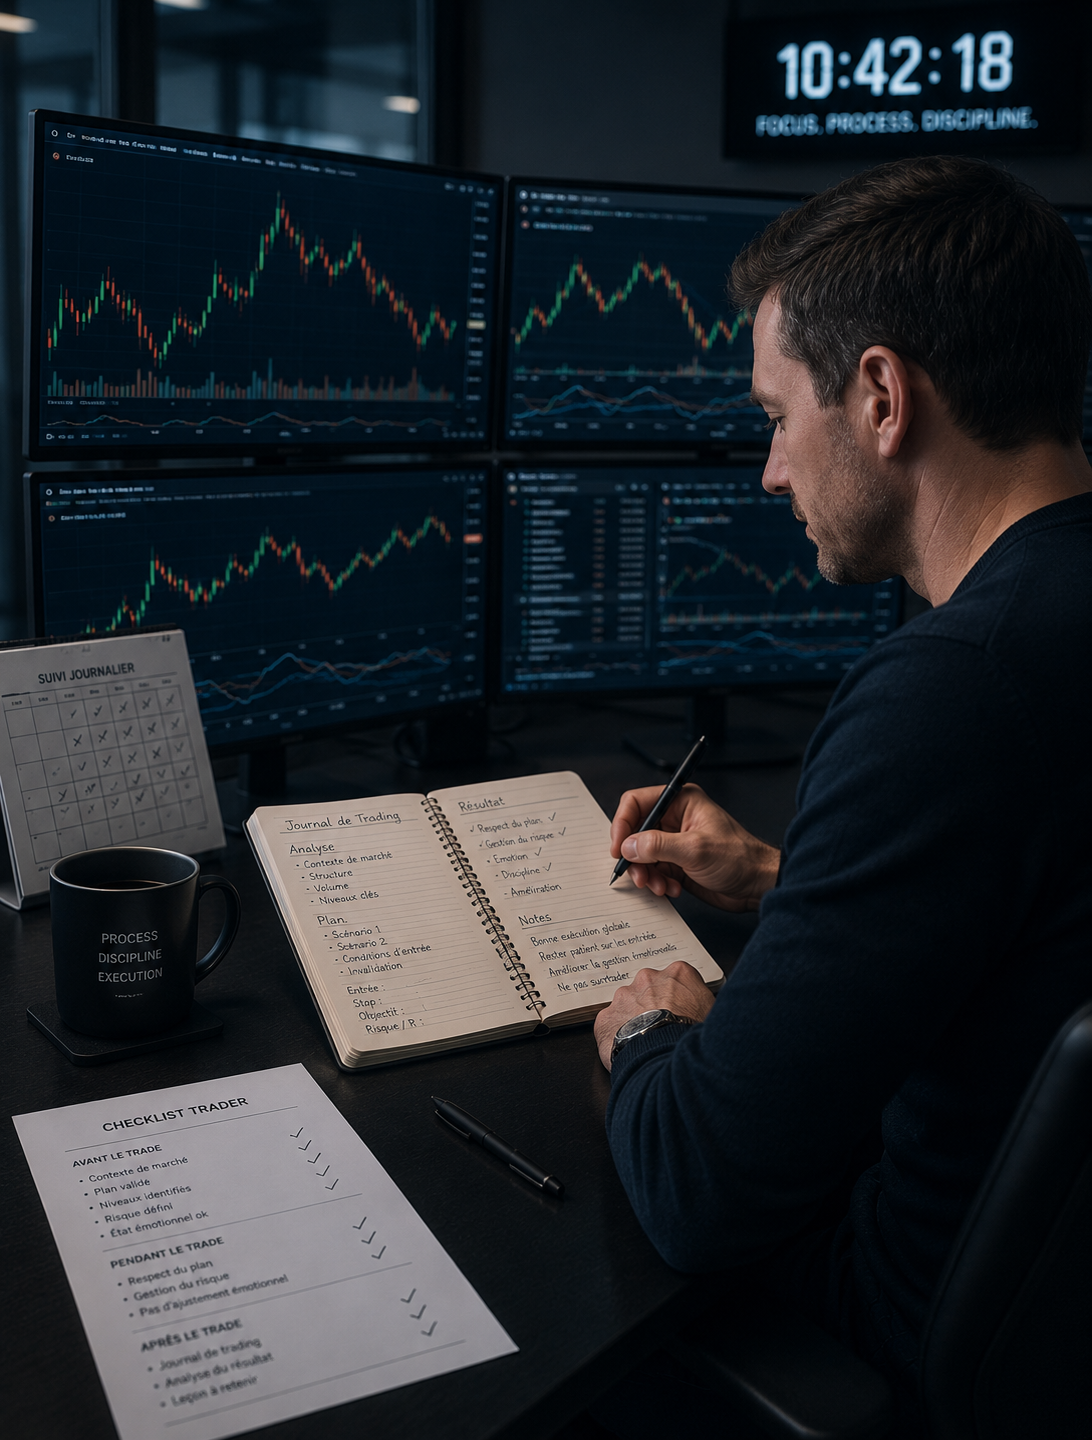
When used correctly, technical indicators allow you to gain clarity, timing and discipline.
When used incorrectly, they confuse you.
That's why at Xeilos, we not only teach how to read them, but when and why to use them within a coherent strategy.
🎯 Do you want to learn how to trade with these indicators in a professional setting?
👉 Take 15 minutes with a Xeilos trainer to check for free if our program is right for you:






















One comment
Thank you for this very clear article. It's true that at the beginning, we tend to want to pile every possible indicator on our chart, which ends up making decision-making completely illegible. Your advice to limit oneself to 2 or 3 tools like the RSI or MACD is essential for maintaining discipline.
For my part, I've noticed that the hardest part isn't reading the indicator, but remaining consistent in its application without being swayed by market noise. That's why I'm increasingly interested in AI-assisted analysis, particularly with StarQuant.ai. The idea is precisely to automate the filtering of these technical indicators to receive only clean signals and avoid overtrading. It's an excellent step after mastering the fundamentals you teach here.
Looking forward to reading your next articles!